Diferencia entre revisiones de «Definir y dibujar una función»
De Software Libre para la Enseñanza y el Aprendizaje de las Matemáticas (2010-11)
| Línea 7: | Línea 7: | ||
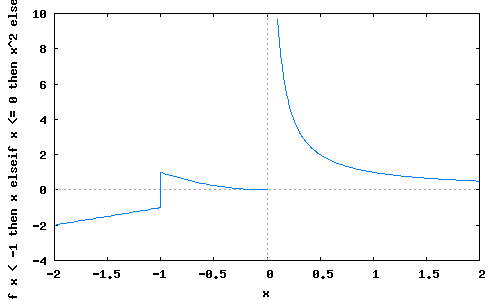
(%o1)d(x):=if x<-1 then x elseif x<=0 then x^2 else 1/x | (%o1)d(x):=if x<-1 then x elseif x<=0 then x^2 else 1/x | ||
(%i2)wxplot2d(d(x), [x,-2,2], [y,-4,10]); | (%i2)wxplot2d(d(x), [x,-2,2], [y,-4,10]); | ||
| − | Archivo:Función.png | + | [[Archivo:Función.png]] |
Revisión actual del 08:40 7 abr 2011
Enunciado (Elena Regodón Domínguez):
- Definir y dibujar la función d(x)=x si x<-1; =x^2 si -1<=0; =1/x, si x>0]].
Solución (Elena Regodón Domínguez):
(%i1)d(x) := if x<-1 then x
          elseif x<=0 then x^2
          else 1/x;
(%o1)d(x):=if x<-1 then x elseif x<=0 then x^2 else 1/x
(%i2)wxplot2d(d(x), [x,-2,2], [y,-4,10]);